Data Analysis Skills for STEM Students

As the summer holidays come to a close and we look ahead to the coming academic year, it’s helpful to consider the type of skills that might best complement your university applications.
For students interested in pursuing degrees in STEM (Science, Technology, Engineering and Mathematics), data analysis is an excellent skillset to develop. In particular, data analysis skills are used in research, problem-solving and innovation across STEM disciplines – both in the classroom and beyond.
With an ever-growing demand for data-driven professionals, data analysis skills can significantly boost your employability.
The Role of Data Analysis in STEM
There are numerous ways in which data analysis is used in the STEM field, and therefore numerous reasons for STEM students to develop sophisticated data analysis skills.
Data analysis is pivotal in providing academic insights and supporting evidence-based research across STEM disciplines. Take the following example:
If we want to develop technologies to address disparities in global healthcare, scientists must first analyse the relevant data on the populations and health concerns present in different locations. This analysis then informs the response of practitioners across the STEM field – from students to doctors to engineers.
Data analysis skills can also enhance the credibility and reliability of research findings in science, technology, engineering and mathematics. Given the complex nature of certain data sets, the ability to analyse and apply data to the broader STEM field is reassuring to anyone looking to adopt and expand upon the original research.
Additionally, learning to present data analyses in a clear and concise way – so readers from a variety of disciplines can understand and interpret research findings – is a highly valued skill across STEM subjects.
Key Data Analysis Techniques in STEM
There are various data analysis techniques available; here are three of the key techniques STEM students might like to develop:
I. Statistical analysis
Statistical analysis is the process of collecting and analysing large amounts of data to identify trends and present relevant interpretations.
While this is a technique that can extend beyond STEM disciplines, it’s fundamental to science, technology, engineering and mathematics.
Due to the large volume of data that informs STEM research, as well as the data-driven nature of STEM careers, it’s crucial that aspiring students develop their statistical analysis skills.
Statistical analysis in STEM can be understood through a few key concepts, including:
- Descriptive statistics – using coefficients that summarise a given data set to concisely explain its contents
- Inferential statistics – using measurements from a sample of subjects to make generalisations about the larger population
- Probability – numerically measuring how likely an event is to occur
Statistical analysis can be used to conduct scientific experiments, analyse relevant survey data and draw conclusions from sample data, which can then be applied to broader generalisations.
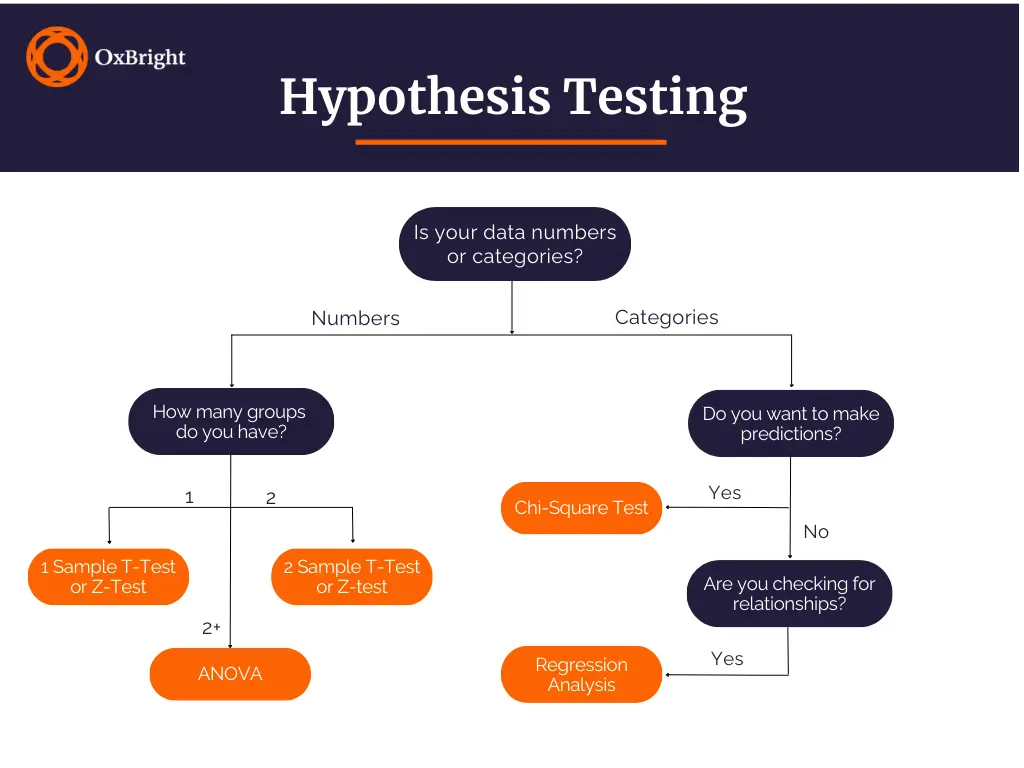
II. Hypothesis testing
Hypothesis testing describes the process of assessing the likelihood of a given hypothesis by studying sample data.
The steps involved in hypothesis testing are:
- Formulating null (the assumption that the event won’t occur) and alternative hypotheses
- Selecting the appropriate tests for the hypotheses
- Interpreting the results against the original set of hypotheses
Within the STEM field, hypothesis testing is used to validate scientific hypotheses and make data-driven decisions.
For example, if a hand sanitiser manufacturer claims that their product is 95% effective, a researcher can create a null hypothesis (95% effective) and an alternative hypothesis (less than 95% effective).
They can then conduct a hypothesis test to determine the true effectiveness of the sanitiser. These results can be used to either market the product or make improvements.
III. Data visualisation
The final data analysis technique for STEM students is data visualisation – otherwise known as the use of words, images and graphics to present complex data in a clear and concise manner.
Data visualisation techniques can vary, and include graphs, charts and heatmaps.
Like the other techniques, the use of data visualisation in STEM aids in communicating research findings to the broader public, as well as helping to identify trends and patterns in complex datasets.
Data Analysis Tools and Software
There are also several data analysis tools that are useful for students in STEM.
1. Python
Python has emerged as a versatile and popular programming language for data analysis. It supports multiple programming paradigms, including structured and functional programming.
Utilising a series of libraries, such as Pandas, NumPy and Matplotlib, Python facilitates data manipulation, numerical computations and data visualisation.
It can also be applied in scientific computing and data-driven research. In particular, as artificial intelligence continues to expand, libraries such as Pandas can be used for machine learning applications. Python is also used in multiple AI solutions like image recognition and data processing.
2. R
R is a statistical programming language widely used in data analysis and research, especially across the social sciences.
Used among data miners, informaticians and statisticians, R is also useful in the development of statistical software. It has an extensive collection of packages for statistical modelling, data visualisation and machine learning, as well as a large number of extension packages.
R supports data analysis in various STEM domains, including biology, economics and environmental science, making it significant for students across a variety of STEM disciplines.
3. MATLAB
Given its capabilities for mathematical modelling, simulations and signal processing, MATLAB has emerged as a powerful tool for numerical computing and data analysis. It’s also used to develop algorithms and create data-driven models.
Specifically, MATLAB is used in STEM to solve complex engineering problems and analyse experimental data. It’s often used in computational finance to develop quantitative applications for investment management and econometrics.
4. Microsoft Excel
While many STEM students will already be familiar with Microsoft Office and its myriad applications, Excel is an especially useful tool for data analysis. The accessible nature of Excel makes it a widely available tool for basic data analysis across various data-driven fields.
Notably, Excel is especially suitable for the organisation of data in charts and tables, the filtering of raw numerical data into concise groupings, and the creation of statistical charts.
For aspiring STEM students, Excel is also particularly useful for introductory data analysis tasks and simple statistical calculations.
Developing Data Analysis Skills
There are many ways to develop data analysis skills for a career in STEM:
1. Start with the basic tools and techniques; familiarise yourself with statistical inferences and create a chart in Excel
2. Learn from others, such as accomplished professors in a given STEM discipline
3. Learn data visualisation, to concisely view and interpret collected data
4. Work on real-world projects, such as data-driven innovations in the natural sciences, through online internships and programmes
5. Analyse different types of data
6. Learn to communicate effectively
7. Practise!
In addition to the above tips, there are also a variety of online resources and courses that can be utilised to cultivate the relevant data analysis skills in STEM!
Given this demand, there are a number of potential career opportunities for individuals proficient in STEM-related data analysis. Students with demonstrated data analysis abilities might serve as data analysts, data engineers, data architects or data visualisation specialists, as well as finding career opportunities in any number of fields, ranging from healthcare to entertainment!

By Adam Kluge
Adam (he/him) recently completed his MSc in Criminology and Criminal Justice at the University of Oxford. His research exists at the intersection of law, politics, and history – and he welcomes opportunities to further explore these areas through personal and pedagogical practices. He completed his undergraduate degrees at Columbia University and will begin a PhD in Criminology at Oxford this autumn.
Ready to get a head start on your future?
Recommended articles

OxBright Tutors Share Their Top Tips for High School Graduates
Finishing high school can be a really intimidating juncture – you’re leaving the security of a routine you’ve followed for five plus years, and you’re faced with more options and less structure than ever before. Oh, and your decisions now can shape your future in a...

Which Career Is the Best Fit for Me?
Choosing your career path is one of the first big steps you’ll take as a young adult, so it can often be a daunting prospect. However, the possibilities are endless, and as long as you base your choices on your personal preferences, passions and interests, your...

How to Make a Study Schedule That Actually Works
Studying can sometimes feel like a daunting task, no matter how old you are or what level you’re studying at. You might be left thinking: How can I balance academics with my other commitments? How do I stay consistent with a study schedule? Is there a “good” or...